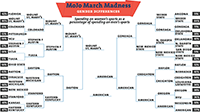
March Madness is big business. The tournament rakes in $1 billion in ad sales, $771 million in broadcast rights, and a countless amount in office pool payouts that you never win. (Players will make $0, though a select few are compensated in torn nylon.) Here’s what two NCAA tournament brackets would look like if teams advanced by measures other than points scored: total athletic revenue and total men’s basketball expenses per win this season.
Revenue
What’s amazing about filling out a bracket based on athletic department wealth (see above) is how similar it looks to a bracket based on real tournament predictions. The school with the least revenue, Mount St. Mary’s at $7.5 million, doesn’t even make it out of the play-in game with Albany (a result that mirrors real life). Deep-pocketed Texas emerges from a difficult region (Texas, Michigan, and Tennessee all have nine-figure revenues, with Louisville coming close) to take home the trophy.
Win Cost
By taking a school’s total men’s basketball expenses, we can figure out how much each team spent per win this season. North Carolina Central, with its relatively small budget and 28-5 record, spent only about $34,000 on each victory. (This ignores strength of schedule—wins in the Mid-Eastern Athletic Conference can be easier to come by than wins in a more powerful conference). On the other end, Ohio State took home the “least efficient” title, dropping more than $750,000 per win. Five other teams—Duke, Kentucky, Louisville, Syracuse, and Oklahoma State—also broke the half-million-per-victory mark.


