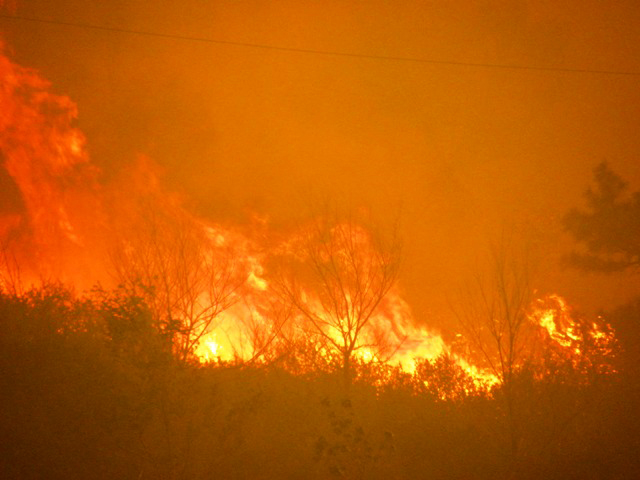
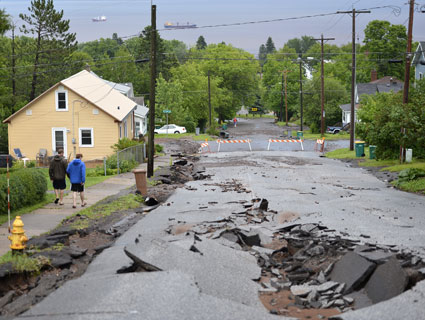
Credit: diametrik via Flickr
NOAA’s latest National Climatic Data Center (NCDC) State of the Climate report is out, and it’s pretty impressive in the trends and records department.
More on the report below. But, first, I can’t help but think of it in light of an interesting new paper in Nature Climate Change today. Researchers studying tree-ring data from living trees and dead trunks preserved in lakes in Finnish Lapland found a much longer-term cooling trend over the past 2,000 years than previously understood. This trend involves a cooling of -0.3°C per millennium due to a gradual increase in the distance between Earth and the sun.
“This figure we calculated may not seem particularly significant,” says lead author Jan Esper, “however, it is also not negligible when compared to global warming, which up to now has been less than 1°C. Our results suggest that the large-scale climate reconstruction shown by the Intergovernmental Panel on Climate Change likely underestimate this long-term cooling trend over the past few millennia.”
Which implies that human-induced global warming might actually be higher than we’ve been calculating. Perhaps this is contributing to a disturbing trend researchers are beginning to notice—that extreme weather events are proving more extreme than we’ve predicted.
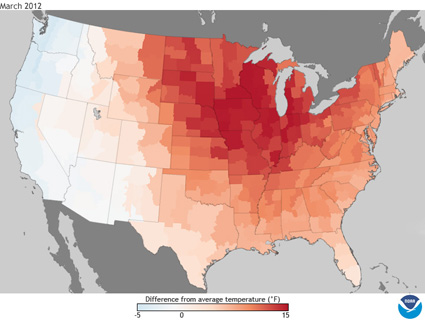
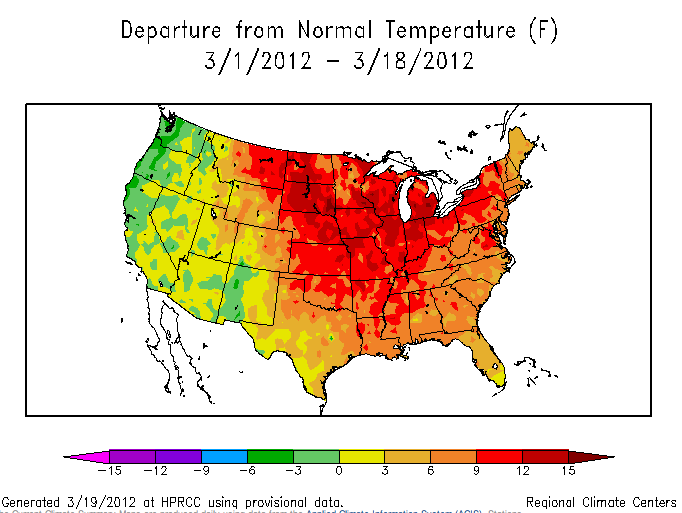
 Contiguous US temperature average for January to June 2012 NOAA | National Climatic Data Center
Back to the NCDC report. The past six months, January to June 2012, just ranked as the warmest first half of any year on record for the contiguous United States.
As you can see in the graph above, the past six months of extremes contributed to a warming trend of 1.7°F per century.
Highlights from the January-June 2012 period:
- The national temperature of 52.9°F was 4.5°F above the 20th-century average.
- Most of the contiguous United States was record and near-record warm for the six-month period, except the Pacific Northwest.
- 28 states east of the Rockies were record warm.
- 15 additional states were top-10 warm.
- The first six months of 2012 were also drier than average with a nationally averaged precipitation total 1.62 inches below average.
According to the report, the extremes in the first half of 2012 were the most extreme of the extremes:
The U.S. Climate Extremes Index (USCEI), an index that tracks the highest and lowest 10 percent of extremes in temperature, precipitation, drought and tropical cyclones across the contiguous U.S., was a record-large 44 percent during the January-June period, over twice the average value.
 Warmest 12-month periods 1895-2012 NOAA | National Climatic Data Center At an even larger scale, note that all the 12 warmest 12-month periods since 1895 have occurred since 2000. And that the past 12 months busted a record broken only last month.
Even more interesting, the past 12 months (July 2011-June 2012) saw each month measuring among the warmest ever on record. From the NCDC report:
During the June 2011-June 2012 period, each of the 13 months ranked among the warmest third of their historical distribution for the first time in the 1895-present record. The odds of this occurring randomly is 1 in 1,594,323.
 Year-to-date average temperatures for select locations (click for full list) NOAA | National Climatic Data CenterThe list above shows only the beginning of 150 stations recording crazy temperatures in the first half of this year. You can see the full list of 150 locations with long-standing weather data and their records here.
The temperature anomalies for the first half of 2012 are impressive enough to be game changing. NOAA’s National Climatic Data Center report describes them:
In some locations, 2012 temperatures have been so dramatically different that they establish a new “neighborhood” apart from the historical year-to-date temperatures.
 Scottsbluff, Nebraska, year-to-date average temperatures, January to June 1893-2012 NOAA | National Climatic Data CenterAmong many notable records, these stand out:
- Scottsbluff, Nebraska, broke the longest-running record of 116 years with temperatures running 5.3°F above average this year (see graph, above, and note the 116-year temperature trend ticking relentlessly upward).
- Green Bay, Wisconsin, wracked up the highest departure from average for the first half of this year with temperatures 7.6°F above normal.
- As a region the upper Midwest saw the biggest departures from average with Des Moines, Iowa, at 7.3°F above average; Fargo, North Dakota, at 7.0°F above average; and Rochester, Minnesota, at 7.1°F above average.
Every state across the contiguous US had warmer than average temperatures between July 2011 and June 2012, except Washington, which was near normal.