Monster Heat Wave Stomps NOAA Website


Derived from Mizunoumi via Wikimedia Commons.

Derived from Mizunoumi via Wikimedia Commons. 

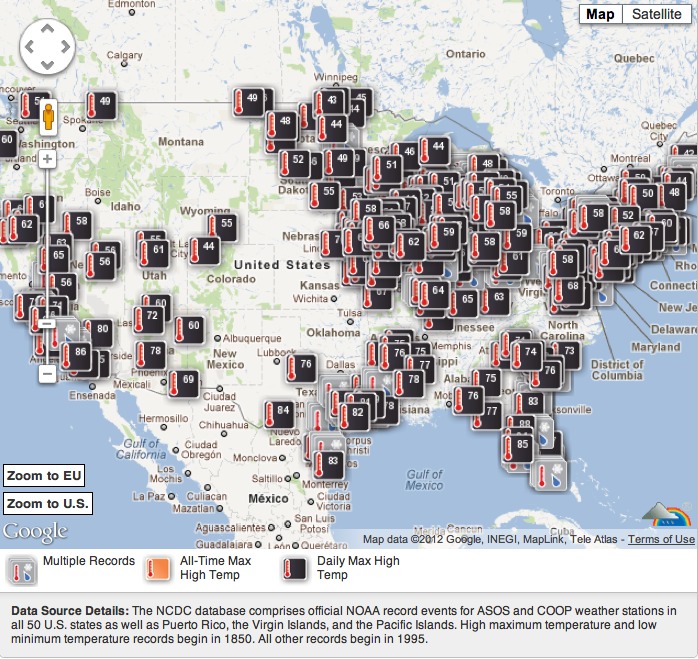
March’s mutant heat has been so extreme it’s crashed the ‘Extremes’ section of NOAA’s National Climatic Data Center (NCDC) website. Why? Because:

  1. the software couldn’t handle the huge number of high-temperature records being set and
  2. the site couldn’t handle the huge demand from people wanting to see the records

I’ve been so frustrated at being unable to access the site in the midst of one of the most extreme weather events in more than a century of record keeping that I found myself visited by a feverish little brain worm called ‘conspiracy.’ 

Credit: NOAA National Climatic Data Center.Credit: NOAA National Climatic Data Center.

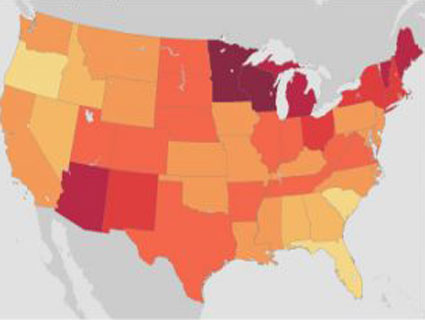
But according to Jeff Masters at Wunderblog the NCDC has spent the week reengineering their software to handle the extreme load on both records and demand.

Today the site is up and running again—though only with data through last Sunday. You can see in the chart above the monster rate of broken records. A few noteworthies:

  • Not only are daytime high-temp records (Hi Max) falling but more impressively the number of nighttime high-temp records (Hi Min) are falling nearly as fast.
  • Hi Max records are outpacing Lo Max (daytime low-temps) records by 25-to-1 last week.
  • Hi Min records are outpacing Lo Min (nighttime low-temps) records by 16-to-1 last week.


Historic heat wave in N. America turns winter to summer: NASA Earth Observatory image by Jesse Allen, using data from the Level 1 and Atmospheres Active Distribution System (LAADS).

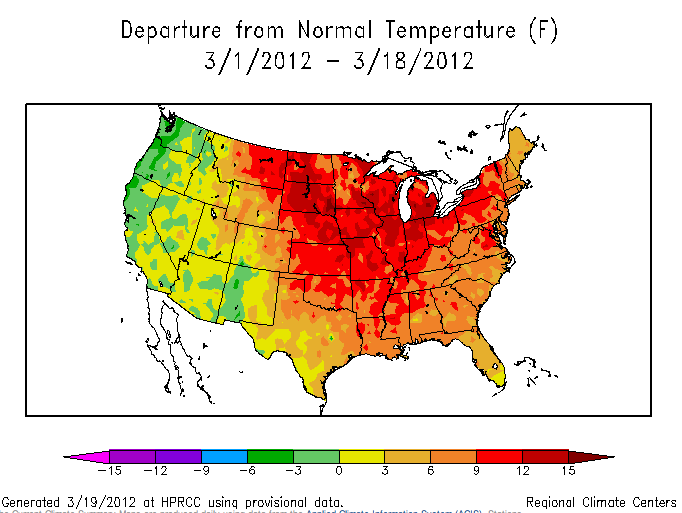
Monster heat wave in N. America turns winter to summer: NASA Earth Observatory image by Jesse Allen, using data from the Level 1 and Atmospheres Active Distribution System (LAADS). 

NASA’s Earth Observatory just published this map showing the intensity and scope of the heat wave as surface temperature anomalies. The map compares the current heat wave to average temps for the same eight-day period in March from 2000-2011. Warmer than average temps are red, near-normal temps are white, cooler than average are blue. From the Earth Observatory:

Records are not only being broken across the country, they’re being broken in unusual ways. Chicago, for example, saw temperatures above 26.6°Celsius (80°Fahrenheit) every day between March 14-18, breaking records on all five days. For context, the National Weather Service noted that Chicago typically averages only one day in the eighties each in April. And only once in 140 years of weather observations has April produced as many 80°Fahrenheit days as this March. Meanwhile, Climate Central reported that in Rochester, Minnesota. the overnight low temperature on March 18 was 16.6°Celsius (62°Fahrenheit), a temperature so high it beat the record high of 15.5°Celsius (60°Fahrenheit) for the same date.


 Global temperature trend: NASA Earth Observatory, Robert Simmon.

Global temperature trend: NASA Earth Observatory, Robert Simmon.

Clearly 2012 is stomping the norm since 2000. And as you can see in this chart of rising global temperatures, the norm since 2000 has stomped all the norms of the prior century.

WE'LL BE BLUNT:

We need to start raising significantly more in donations from our online community of readers, especially from those who read Mother Jones regularly but have never decided to pitch in because you figured others always will. We also need long-time and new donors, everyone, to keep showing up for us.

In "It's Not a Crisis. This Is the New Normal," we explain, as matter-of-factly as we can, what exactly our finances look like, how brutal it is to sustain quality journalism right now, what makes Mother Jones different than most of the news out there, and why support from readers is the only thing that keeps us going. Despite the challenges, we're optimistic we can increase the share of online readers who decide to donate—starting with hitting an ambitious $300,000 goal in just three weeks to make sure we can finish our fiscal year break-even in the coming months.

Please learn more about how Mother Jones works and our 47-year history of doing nonprofit journalism that you don't find elsewhere—and help us do it with a donation if you can. We've already cut expenses and hitting our online goal is critical right now.

payment methods

WE'LL BE BLUNT

We need to start raising significantly more in donations from our online community of readers, especially from those who read Mother Jones regularly but have never decided to pitch in because you figured others always will. We also need long-time and new donors, everyone, to keep showing up for us.

In "It's Not a Crisis. This Is the New Normal," we explain, as matter-of-factly as we can, what exactly our finances look like, how brutal it is to sustain quality journalism right now, what makes Mother Jones different than most of the news out there, and why support from readers is the only thing that keeps us going. Despite the challenges, we're optimistic we can increase the share of online readers who decide to donate—starting with hitting an ambitious $300,000 goal in just three weeks to make sure we can finish our fiscal year break-even in the coming months.

Please learn more about how Mother Jones works and our 47-year history of doing nonprofit journalism that you don't elsewhere—and help us do it with a donation if you can. We've already cut expenses and hitting our online goal is critical right now.

payment methods

We Recommend

Latest

Sign up for our free newsletter

Subscribe to the Mother Jones Daily to have our top stories delivered directly to your inbox.

Get our award-winning magazine

Save big on a full year of investigations, ideas, and insights.

Subscribe

Support our journalism

Help Mother Jones' reporters dig deep with a tax-deductible donation.

Donate