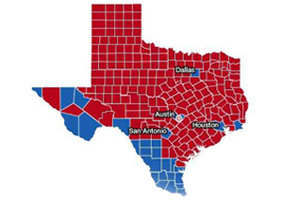
Illinois map: National Atlas, Texas map: Center for Range Voting
Read also: Can one Democrat hell-bent on revenge reverse Tom DeLay’s redistricting power grab?
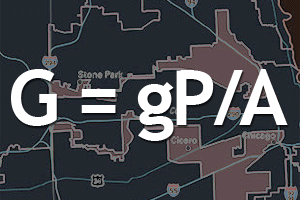
The art of drawing congressional districts to benefit one party or another goes back to the earliest days of the republic. Detailed census and election data have made it even easier to construct electorates with an all-but-guaranteed political leaning. You can usually spot a gerrymandered district by its wacky boundaries. Or you can use this formula (PDF), developed by John Mackenzie, a professor of resource economics and geographic information systems at the University of Delaware:
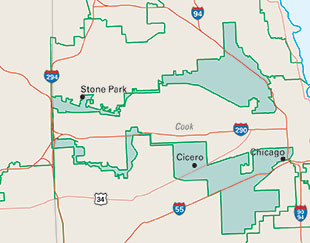
Mackenzie’s formula gives lower gerrymandering scores to districts with a low perimeter-to-area ratio (like the entire state of Wyoming). Higher scores go to irregularly shaped districts, like Illinois’ pincer-like 4th district (above).
The formula doesn’t take into account how a district got its odd contours. Take North Carolina’s 12th, which has the country’s third-highest gerrymandering score. Drawn as a majority-black district in 1992, the snaking “I-85 district” used to be barely wider than the interstate in some places. After being found unconstitutional by the Supreme Court, it was redrawn 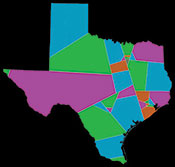 in 1997 with a slight white plurality. But it’s kept its meandering shape, and its representative—Rep. Mel Watt, a black Democrat.
So what might an ungerrymandered nation look like? Mathematician Warren D. Smith, cofounder of RangeVoting.org, has used an algorithm to redraw every state’s districts in a geometrically precise manner that ignores party lines (left). Would his solution shake up the partisan or racial composition of Congress? Who knows. But it sure would look pretty.

