Chart Trivia: Which Is Better, Log or Linear?

Back when I first started charting the spread of coronavirus I decided not to use a logarithmic scale. I figured that log scales were fine for communicating with other professionals, but most laymen have no clue what a log scale is and have difficulty interpreting it even when they’re given an explanation.

Naturally, then, I’m thrilled to pass along a study from the LSE School of Public Policy that confirms I was right. They showed people the following two charts:
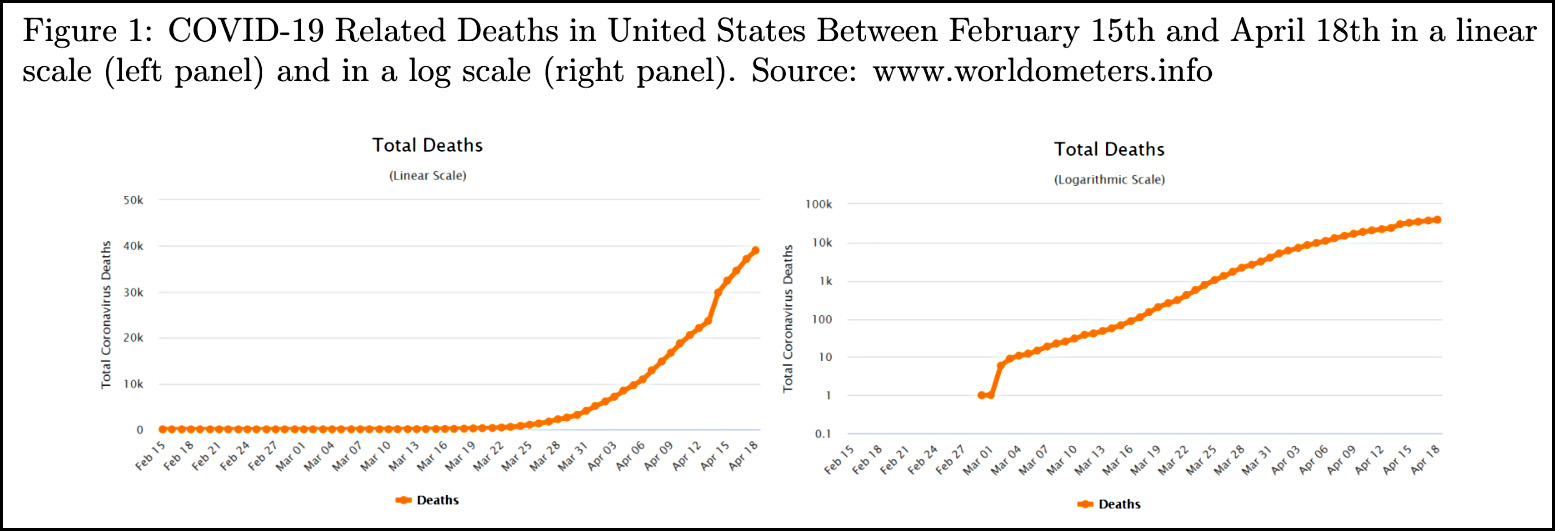
I think they put their finger on the scale by starting the y-axis of the log chart at 0.1, but I don’t suppose many people actually noticed that. In any case, here are the results:

We find that the group who read the information on a logarithmic scale has a much lower level of comprehension of the graph: only 40.66% of them could respond correctly to a basic question about the graph (whether there were more deaths in one week or another), contrasted to 83.79% of respondents on the linear scale. Moreover, people in the logarithmic group also proved to be worse at making predictions on the evolution of the pandemic: they predicted, on average, 71,250 deaths for a week after the experiment was taken, whereas the linear group predicted 63,429.

The first finding here is peculiar: since both charts feature lines that are steadily increasing, why would anyone have trouble saying if there were more deaths in one week vs. another? The later week will always have more. That’s odd.

The second finding, however, is the key weakness of a log chart: people have a hard time interpreting the scale. In the log chart, the final dot looks like it’s at around 60-70,000 deaths or so. It’s not, of course, because the the distance between 10K and 100K increases on a log scale just like the rest of the chart. But most people simply don’t understand that. The linear chart, by contrast, shows clearly that the final dot is at 40K and the death rate is growing quickly.

So how does this affect attitudes toward the COVID-19 pandemic?

First, we find that despite predicting a higher number of deaths, people who were shown the logarithmic scale chart declare to be less worried about the health crisis caused by the coronavirus.

Divergences, however, don’t stop there. The scale of the graph they see affects people’s responses concerning their policy preferences and stated behaviours. Ceteris paribus, respondents who see the information on the linear scale graphs support less strongly the policy of keeping non-essential businesses closed than those who look at the logarithmic one — although they also favour reopening them later. At the same time, those who see the linear graph are more willing to support a hypothetical state-level tax aimed at providing citizens with masks.

It’s not surprising that people shown the log chart are less worried about the virus. The log trendline simply doesn’t look like it’s growing that fast. It’s peculiar, though, that folks shown the linear chart are less supportive of keeping non-essential businesses closed. That’s hard to explain. In any case, I guess I’d like to see a complete breakout of the policy stuff so that it’s clearer how strong the effects are.

Bottom line: Ditch the log charts if you’re writing for a non-professional audience. They leave a seriously misleading impression.

AN IMPORTANT UPDATE

We’re falling behind our online fundraising goals and we can’t sustain coming up short on donations month after month. Perhaps you’ve heard? It is impossibly hard in the news business right now, with layoffs intensifying and fancy new startups and funding going kaput.

The crisis facing journalism and democracy isn’t going away anytime soon. And neither is Mother Jones, our readers, or our unique way of doing in-depth reporting that exists to bring about change.

Which is exactly why, despite the challenges we face, we just took a big gulp and joined forces with the Center for Investigative Reporting, a team of ace journalists who create the amazing podcast and public radio show Reveal.

If you can part with even just a few bucks, please help us pick up the pace of donations. We simply can’t afford to keep falling behind on our fundraising targets month after month.

Editor-in-Chief Clara Jeffery said it well to our team recently, and that team 100 percent includes readers like you who make it all possible: “This is a year to prove that we can pull off this merger, grow our audiences and impact, attract more funding and keep growing. More broadly, it’s a year when the very future of both journalism and democracy is on the line. We have to go for every important story, every reader/listener/viewer, and leave it all on the field. I’m very proud of all the hard work that’s gotten us to this moment, and confident that we can meet it.”

Let’s do this. If you can right now, please support Mother Jones and investigative journalism with an urgently needed donation today.

payment methods

We Recommend

Latest

Sign up for our free newsletter

Subscribe to the Mother Jones Daily to have our top stories delivered directly to your inbox.

Get our award-winning magazine

Save big on a full year of investigations, ideas, and insights.

Subscribe

Support our journalism

Help Mother Jones' reporters dig deep with a tax-deductible donation.

Donate