
 I got some flak yesterday for posting a chart showing the number of police shootings of unarmed blacks and whites without taking into account crime rates. It’s harder to do that than you’d think, since the Department of Justice no longer produces crime statistics by race, but we can get a rough idea.
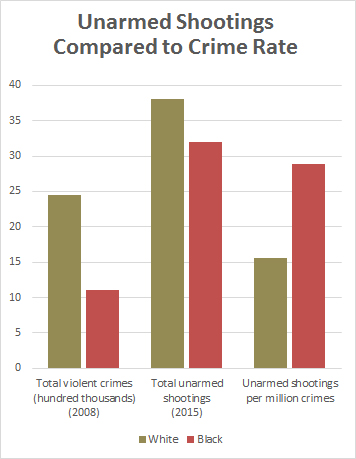
First, we’ll use the National Crime Victimization Survey. This is a telephone survey and isn’t based on arrest rates, so it doesn’t have problems of possible police bias in who they decide to arrest. Second, we’ll use the 2008 numbers for violent crimes (Tables 40 and 46 here), since that’s the last year we have data by race. Obviously this isn’t ideal, but I don’t imagine that violent crime rates by race have changed dramatically since then. We’ll compare this to the number of police shootings collected by the Washington Post for 2015.
The result is on the right. Don’t take it too seriously, but it probably provides a decent rough idea of the disparity in police shootings of unarmed civilians when you account for crime rates. Unarmed whites are shot about 15 times per million violent offenses. Unarmed blacks are shot about 28 times per million violent offenses.
POSTSCRIPT: Needless to say, I’m under no illusion that this will stop the flak. I’m sure plenty of people on both sides of the debate have plenty of adjustments they want to make to the raw data in order to make their own side look better.